
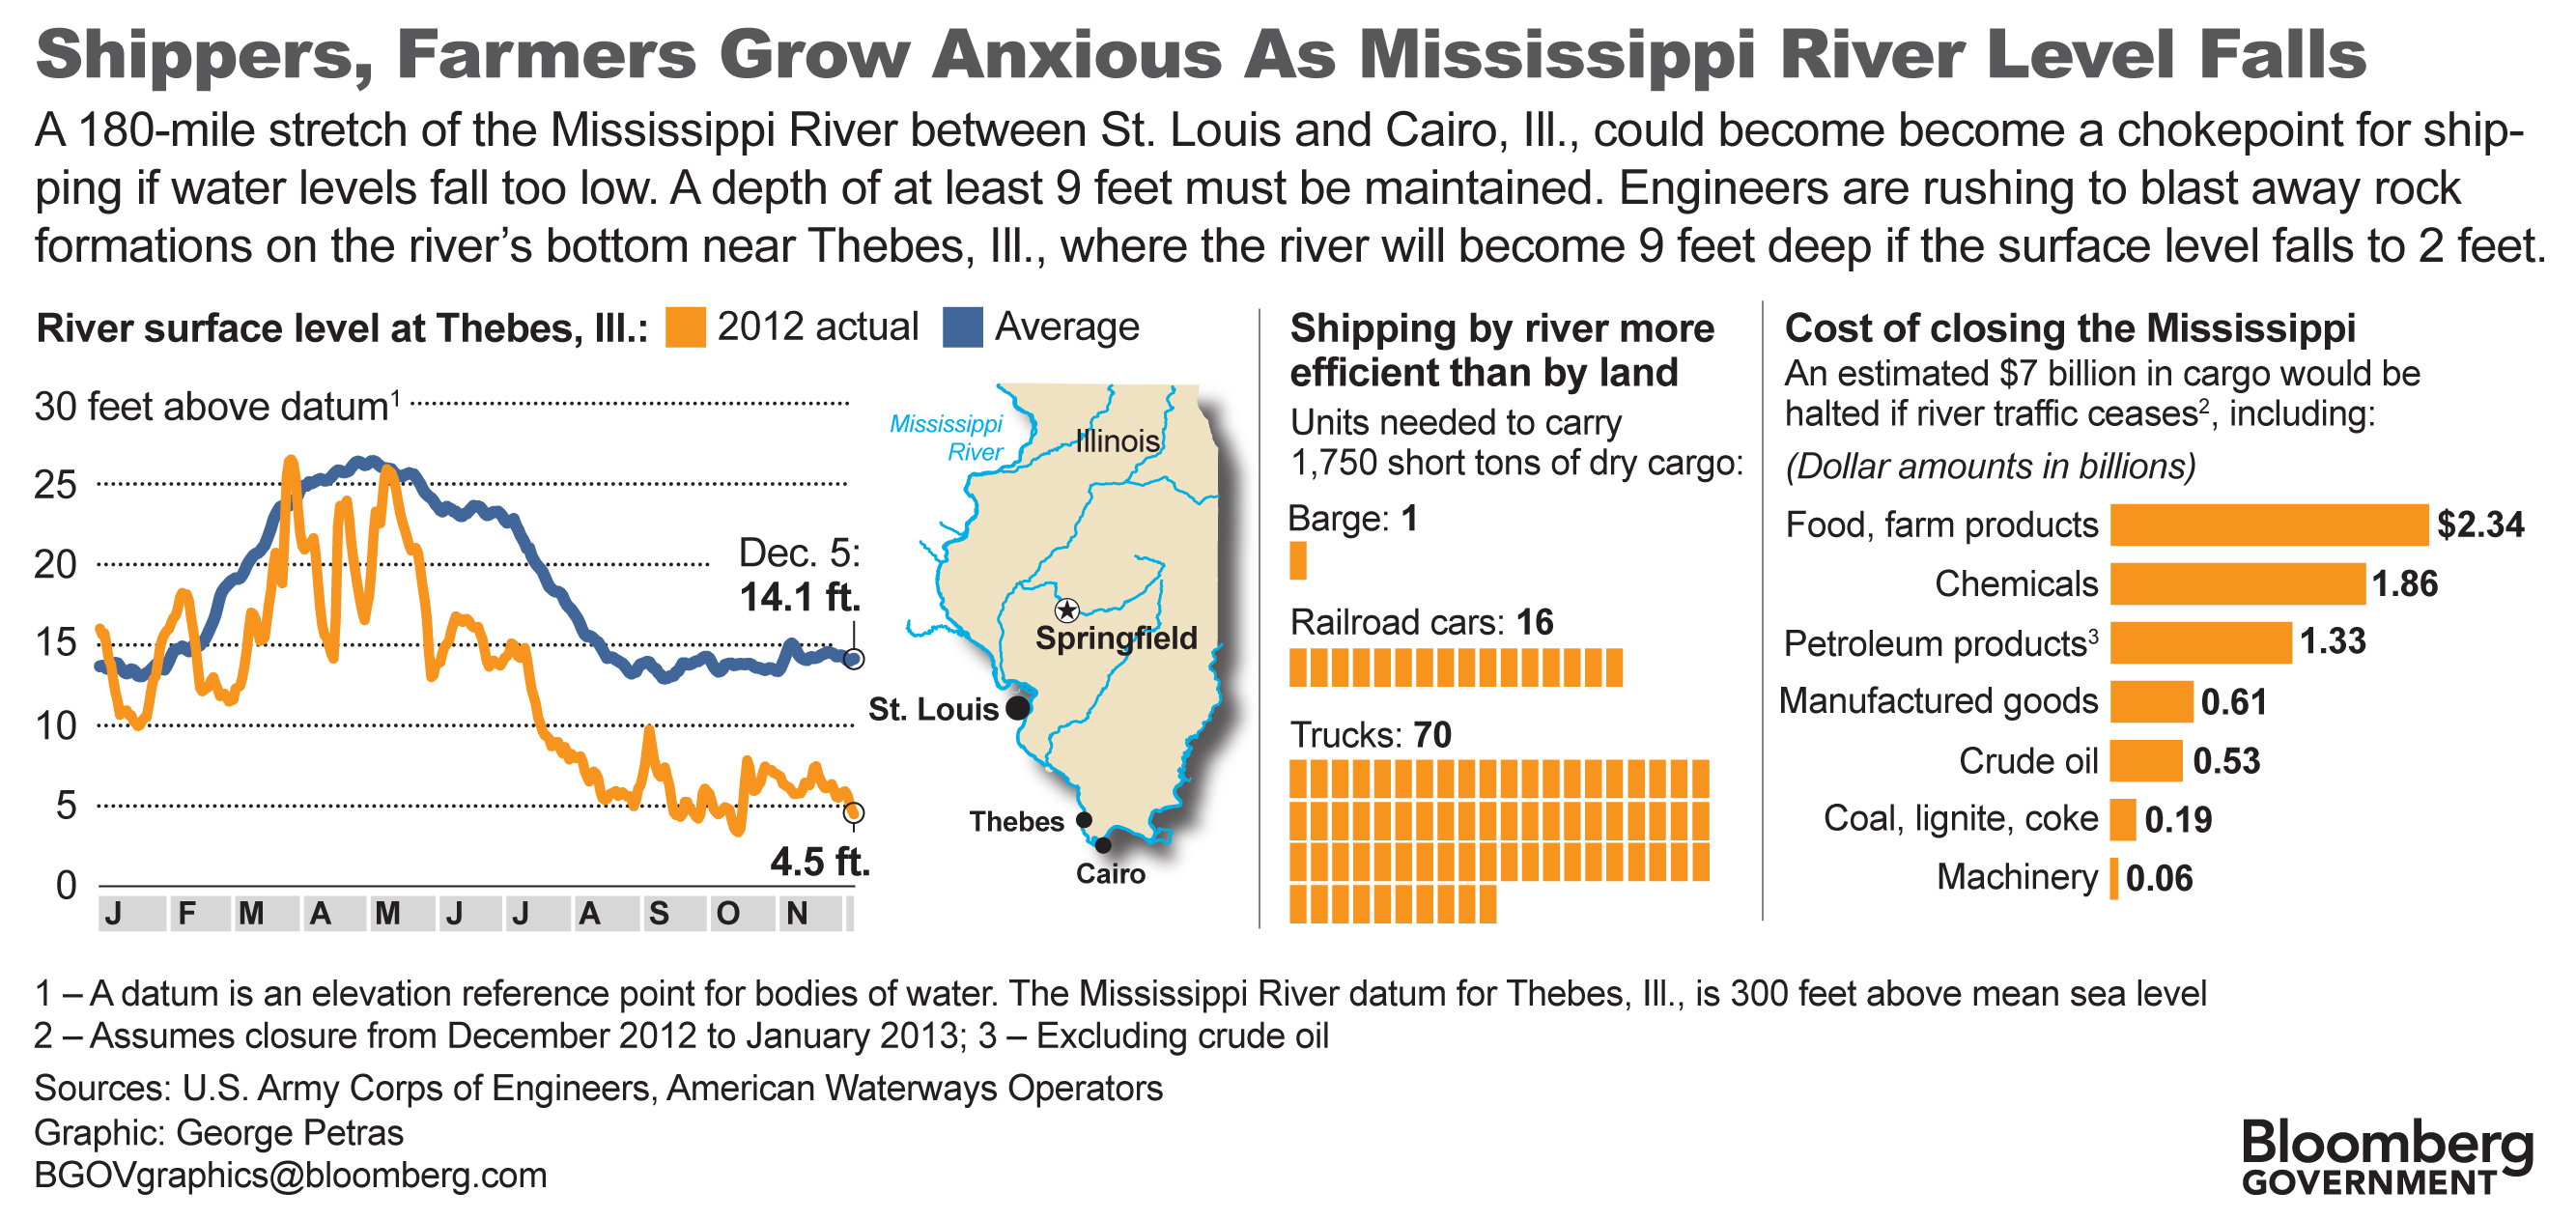
This graphic accompanied a story on the falling level of the Mississippi River and how it affects shipping. A map pinpoints a crucial area of the river and charts show efficiency of river transportation, the cost to various industries of closing the river and changes in river levels. I took pains to explain the term “datum,” since it’s commonly used by the Army Corps of Engineers in river measurements.
