I’m part of a graphics team that works on short- and long-term projects and breaking news. Accordingly, we have unique opportunities for graphic presentations. Here are a few examples from news stories. Some are simple, others more complicated.

This is a standing graphic I update whenever North Korea fires off another missile. Every year and missile is accounted for starting in 1984, when Kim Jong Un’s grandfather launched North Korea’s first projectile.

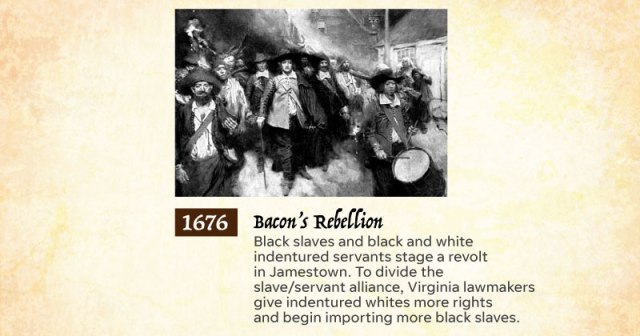
This is a stylized pictograph showing the horrifying survival rate of Africans kidnapped and sold into slavery in the New World. The source is the Smithsonian Institution and this is for our upcoming 1619 project on the first recorded arrival of Africans in the English Colonies.

This chart shows changes in credit card interest rates and how they fluctuated during the 2008 recession and subsequent changes in Federal Reserve interest rates.

We used the classic 1933 movie version of King Kong to demonstrate how skyscrapers in foreign countries tower over those in the U.S. My colleague Jim Sergent came up with the idea.
The movie does not depict Kong climbing the entire height of the Empire State Building, but it does show him going up the 200-ft. high mooring mast. I ran that particular clip on YouTube over and over, timed it, calculated his overall ascent rate, and applied it to the Burj Khalifa in the United Arab Emirates to give readers an amusing and memorable idea of that tower’s height.
Ramon Padilla did a wonderful job of illustrating the concept. A link to the story and interactive is here.

The recent Senate confirmation of Supreme Court associate justice Brett Kavanaugh was one of the most contentious in the court’s history. This chart compares vote totals and gives historical perspective to the Kavanaugh confirmation.