How Obama Won the 2012 Election

11.07.electoral.ALL

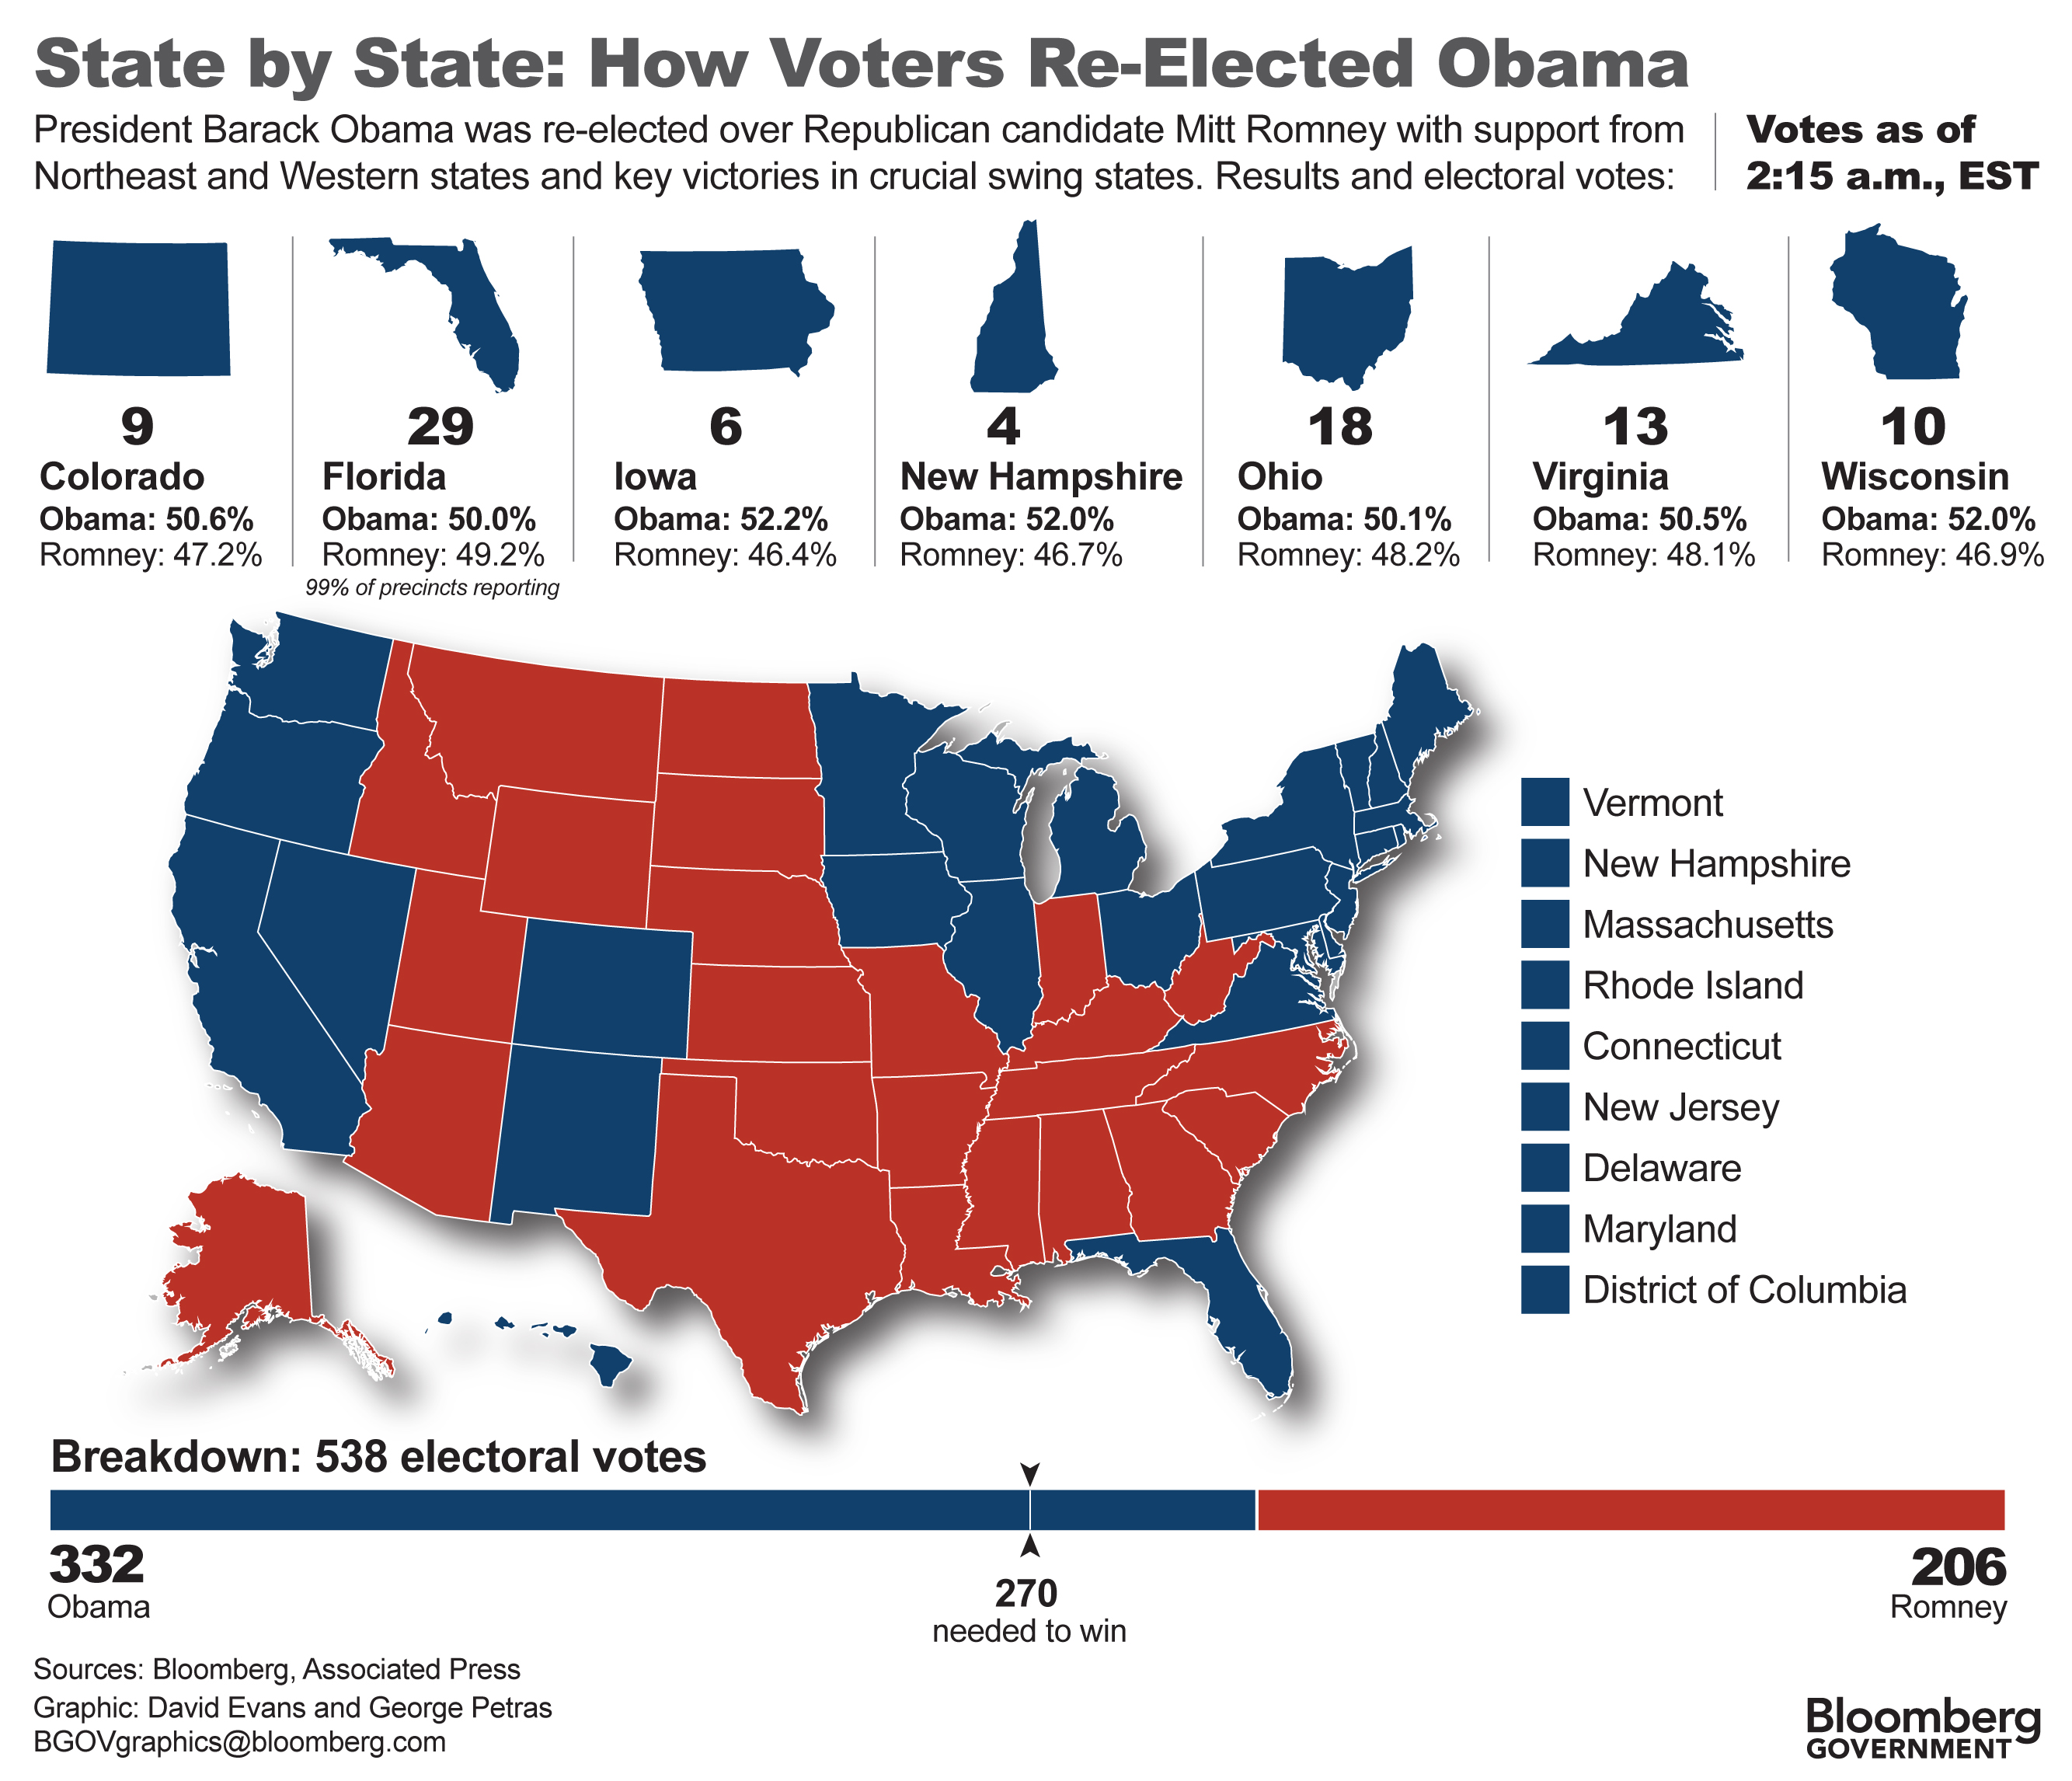
This combination of maps and a bar chart showed which states, especially crucial swing states, supported President Obama on election day. David Evans helped me set up the sliding bar chart, which I constantly updated throughout the evening of the election as results were announced.

This entry was posted in Graphics. Bookmark the permalink.

Leave a Reply

Fill in your details below or click an icon to log in:

WordPress.com Logo

You are commenting using your WordPress.com account. Log Out /  Change )

Facebook photo

You are commenting using your Facebook account. Log Out /  Change )

Connecting to %s