
USA Today publishes a number of special tabloids focused on specific issues – the ones I’ve done include military and historical subjects. I volunteered for the 70th observation tab of the D-Day invasion, some pages of which you’ll see here.
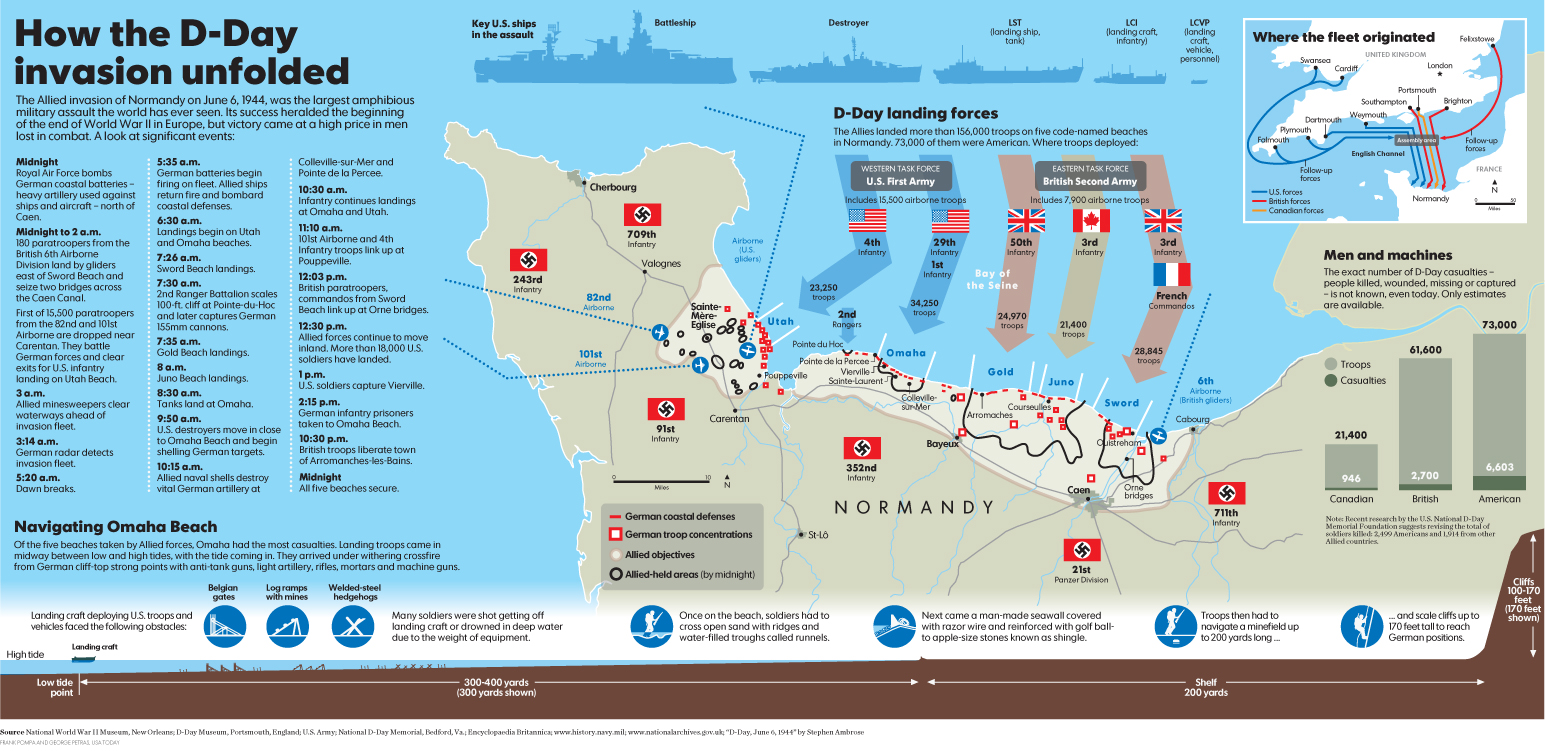
This graphic, one I really wanted to do, shows the scope of the landing and what Allied forces faced. The Normandy coast was divided into five zones for the assault; I chose Omaha Beach as the example.
The American public perhaps knows Omaha best from the 1998 film Saving Private Ryan and other movies. (Everyone’s seen those welded steel girders called hedgehogs.) Omaha also had the highest casualties, because of its curved configuration and the alignment of German defenses. A cross-section of Omaha is shown, giving a sense of scale and the types of anti-personnel devices used. We also show strength of troops deployed, types of ships, and paratrooper drop zones. A timeline lists landings and describes how the day unfolded.
The graphic packs a lot of information into a double-page spread in the center of the tab. I did most of the research by getting a nearly a dozen books from the library and a score of military magazines and scouring the web.
Frank Pompa was the graphic artist and he did his usual wonderful job. He’s a history buff and his knowledge and attention to detail helped make the graphic perfect.
