Plotting With Pictographs

I used a pictograph to display the number of U.S. drone strikes in foreign countries as a quick fix for a display page that had only one photo.

USABrd_USAEast_1_03-20-2015_K2_BON_B_A_008_4_204152.ps

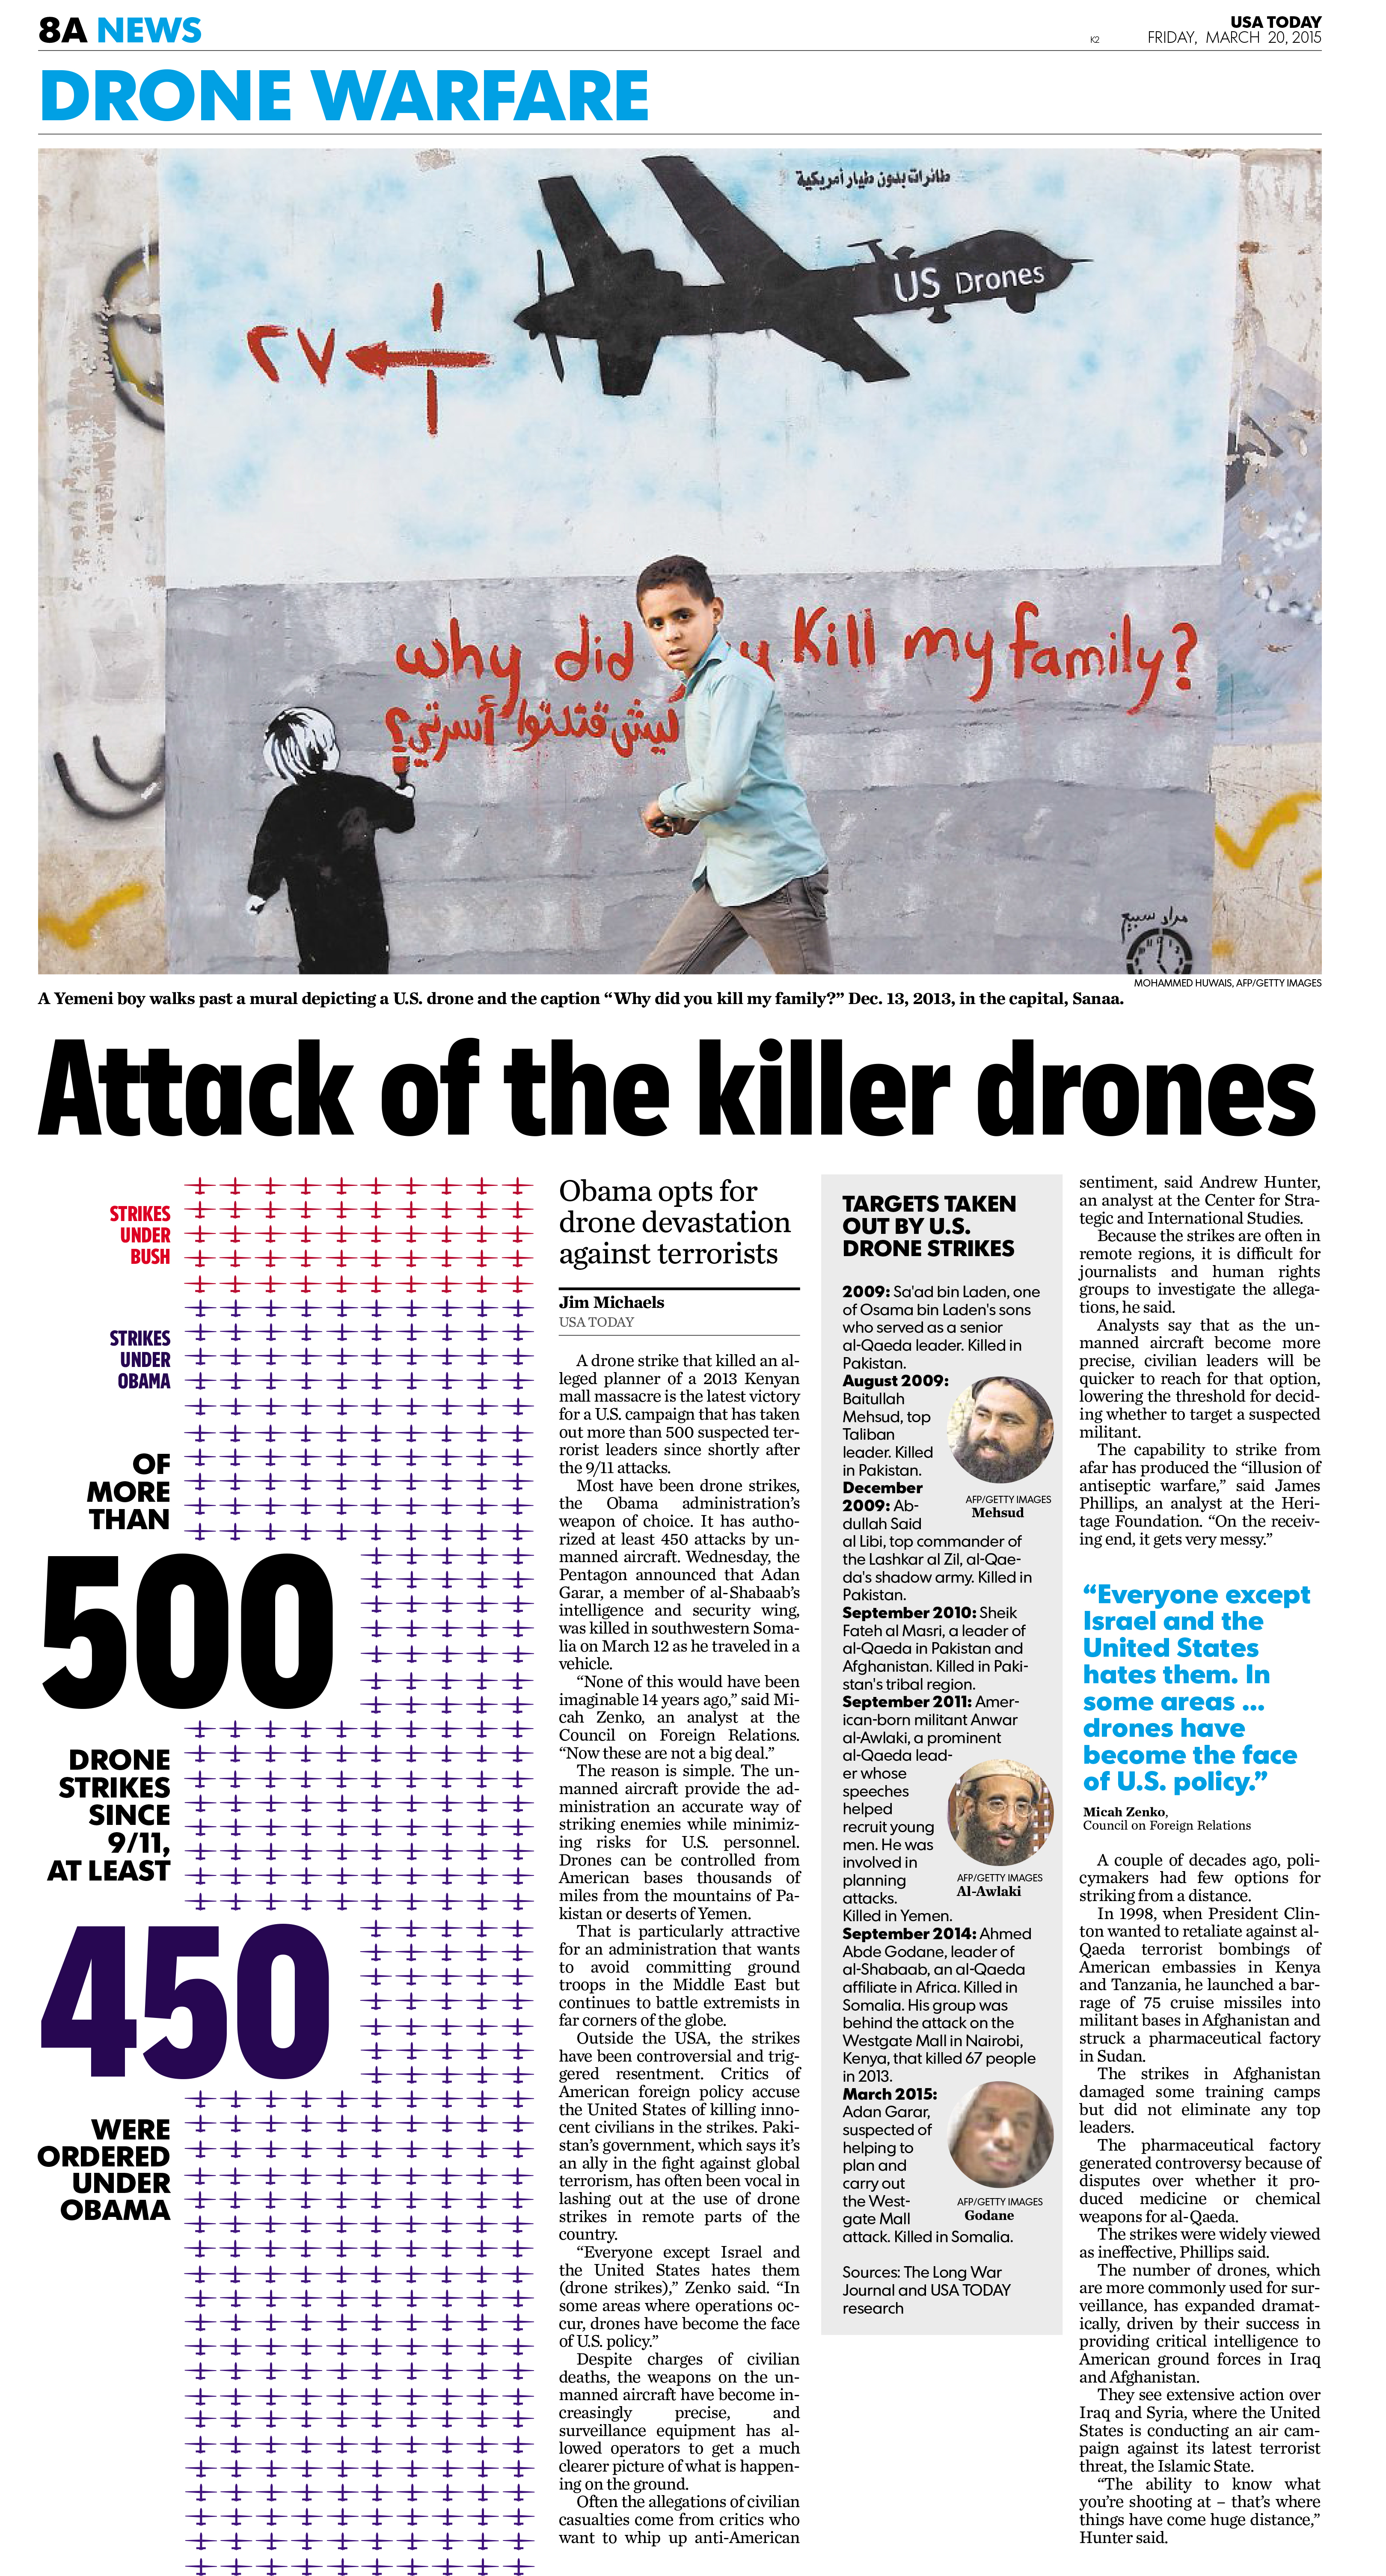
The numbers were taken from the story and I color-coded them to emphasize the story’s point, that more strikes were ordered by the Obama administration than during the Bush presidency.

This entry was posted in Graphics. Bookmark the permalink.

Leave a Reply

Fill in your details below or click an icon to log in:

WordPress.com Logo

You are commenting using your WordPress.com account. Log Out /  Change )

Facebook photo

You are commenting using your Facebook account. Log Out /  Change )

Connecting to %s